
Marriage Statistics Release Day has come early again! Not quite as early as last year’s 23 July, but 28 July is still earlier than the old “last week in November”! Thank you to the Australian Bureau of Statistics for giving me Christmas in July again with today’s release of the 2025 Marriages and Divorces statistics!
Number of marriages
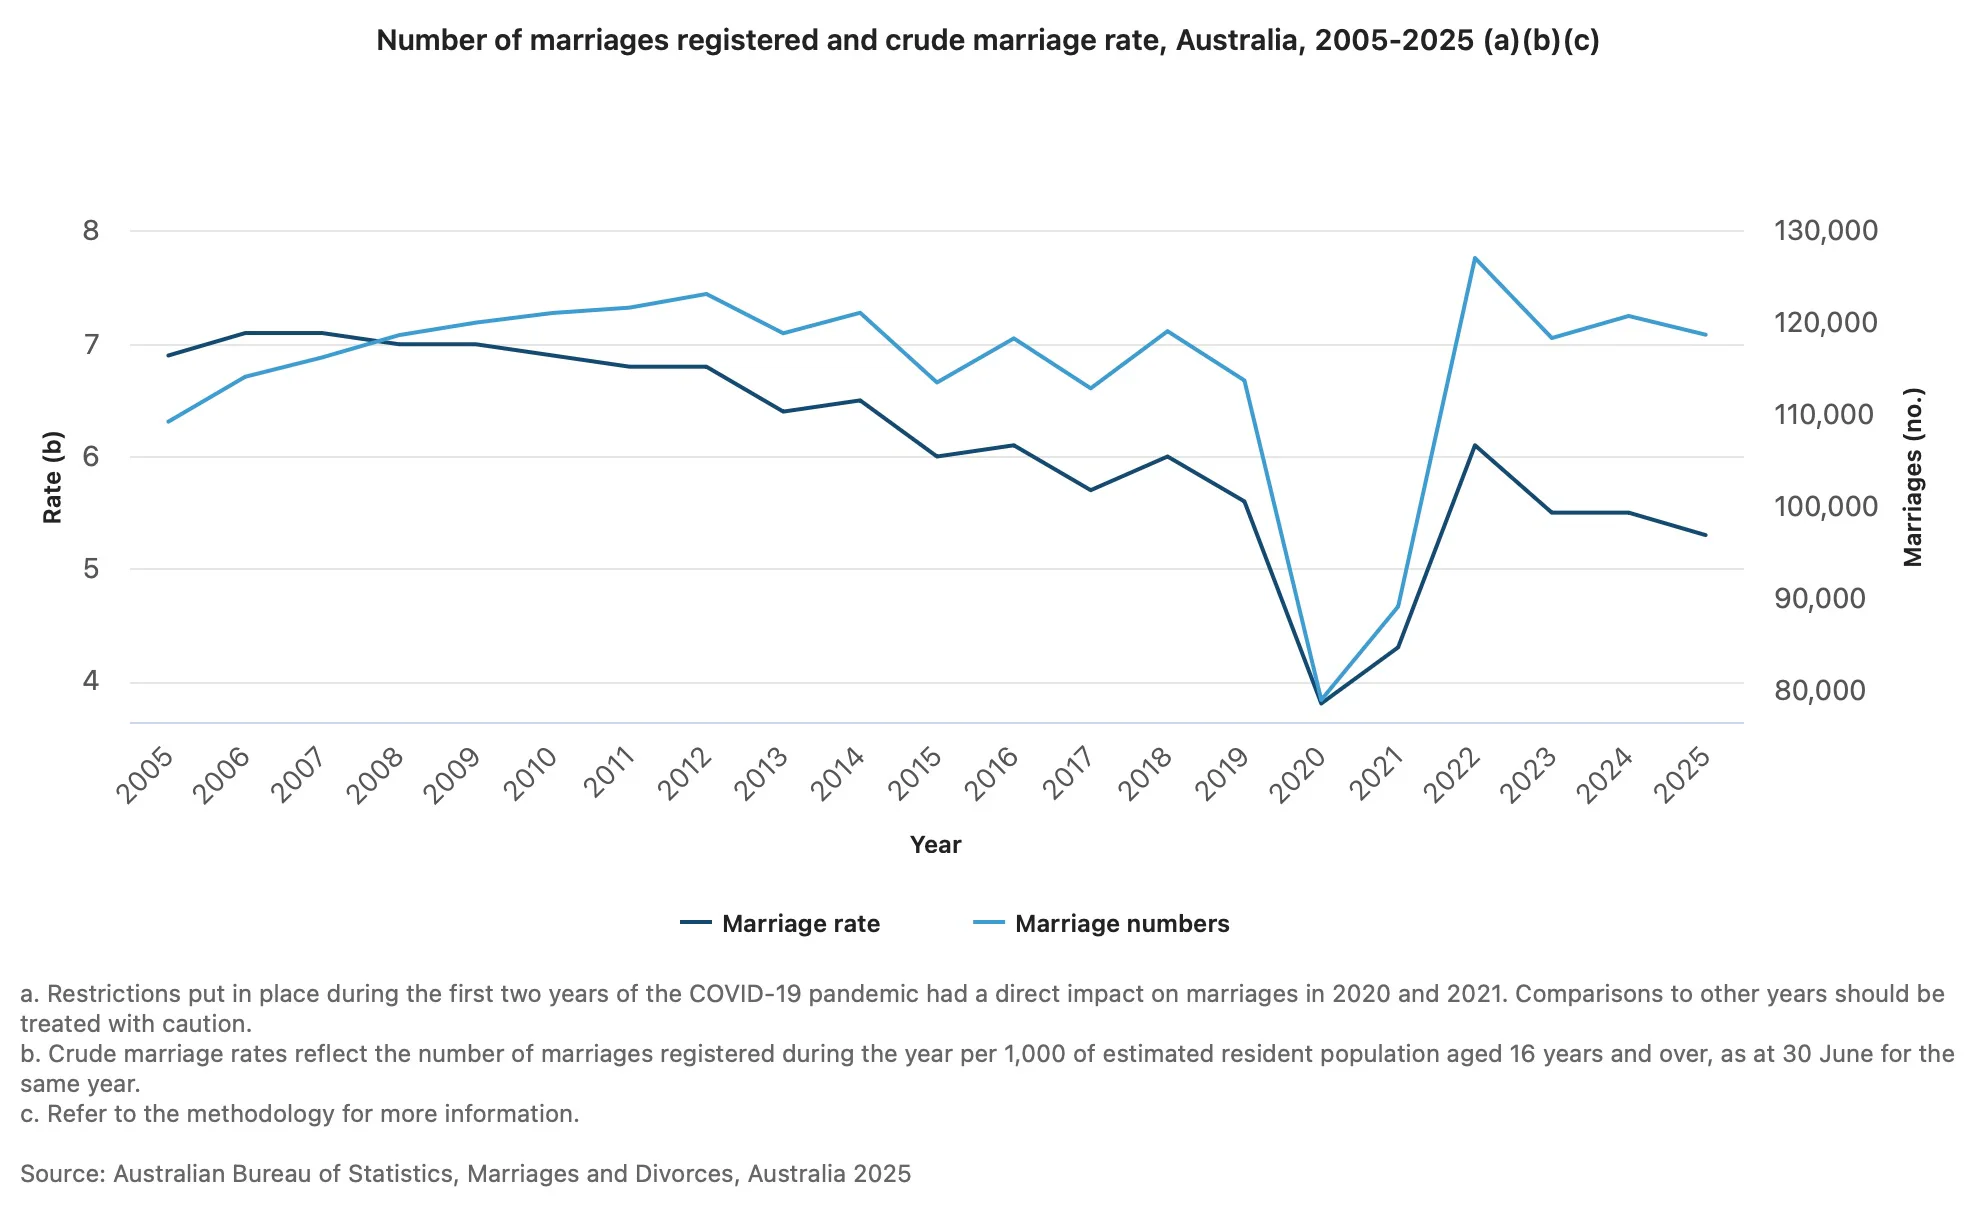
We’re finally seeing that drop in marriage numbers we’ve been expecting for a couple of years, with 1.7% less marriages occuring in 2025 (118,804) than in 2024 (120,844), almost the same number as in 2023 (118,439). Honestly though, it’s still not as big a drop as I might have anticipated given how quiet the industry has been feeling. My theory that people are still getting married, just smaller and cheaper, is probably turning out to be correct. I expect a bigger drop next year, but at this point who knows what’s going on??
Here comes the graph again. We can still see the historic dip in 2020 and 2021 during COVID, the massive rise while all those COVID-stranded couples got married in 2022, then the dip-rise-dip in 2023-2025.
Gender
Again, I love the info on genders of people getting married. I know a lot of people think we shouldn’t be separating out this information, that marriage is marriage and it doesn’t matter who is marrying whom. But I think it’s interesting. We’ve seen another slight increase in the number of marriages involving at least one person who identifies as non-binary, from 159 in 2022 to 204 in 2023 to 231 in 2024 to 260 in 2025. This is the only gender number that has increased; all the others decreased in line with the entire population.
The number of marriages of two female-identifying people was lower than in 2024 (2622 in ’24, 2527 in ’25). The number of marriages of two male-identifying people also decreased (1893 in ’24, 1849 in ’25), in line with the entire population.
As I mentioned previously, I’ve written on my own blog about my interest in these growing statistics on non-binary people getting married, and whether this tells us something about more common usage of this gender identity in the general population. I’m not a researcher, but I think it’s an interesting question.
Age
The median age people get married actually dropped again for men (32.7 years as opposed to 32.8 years in 2023) but stayed the same for women for the third year in a row (31.2 years old). Remember the median is literally the middle number – if we lined up all the ages that people got married from youngest to oldest, the median is the middle number. It’s not an average.
Interestingly, the number of marriages in certain age brackets dropped more than those in others. In most age brackets, less than 300 fewer people married than in 2024. But in the brackets 25-29 and 30-34, the drops were more significant:
| Age | 2024 | 2025 | Difference |
| 16–19 | 1,027 | 1071 | -44 |
| 20–24 | 19,732 | 19,657 | 75 |
| 25–29 | 69,645 | 68,081 | 1,564 |
| 30–34 | 65,932 | 64,841 | 1,091 |
| 35–39 | 32,115 | 31,845 | 270 |
| 40–44 | 16,659 | 16,703 | -44 |
| 45–49 | 10,791 | 10,598 | 193 |
| 50–54 | 9,243 | 8,813 | 430 |
| 55–59 | 6,378 | 6,259 | 119 |
| 60–64 | 4,281 | 4,157 | 124 |
| 65–69 | 2,294 | 2,248 | 46 |
| 70–74 | 1,200 | 1,190 | 10 |
| 75 and over | 1,036 | 1,071 | -35 |
What does that tell us? Possibly nothing, but it could be an interesting thing to monitor to see if it becomes a trend – those in the “typical” age range to marry are marrying less…
Location
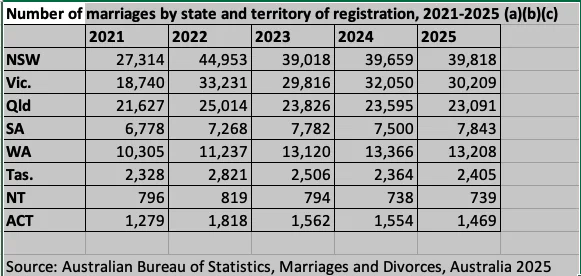
In 2024, New South Wales, Victoria, and Western Australia were responsible for the increase in marriage registrations, with the other five states and territories’ numbers all dropping slightly. 2025 is completely different: New South Wlaes, South Australia, Tasmania, and the Northern Territory had an increase in marriage registrations, with Victoria, Queensland, Wwestern Australia, and the ACT seeing a drop. Stick with me here, because I think this is interesting.
In 2024, Victoria saw the largest increase in marriage registrations year-on-year, with an additional 2234 (7.5%) marriages registered in 2024. In 2025, Victoria saw the largest decrease in number of marriage registrations year-on-year, with 1841 (9.4%) less marriages registered. However it wasn’t the largest percentage decrease; that prize goes to Western Australia, where 9.9% (158) less marriages were registered.
As always, I find this stuff utterly fascinating.
Date
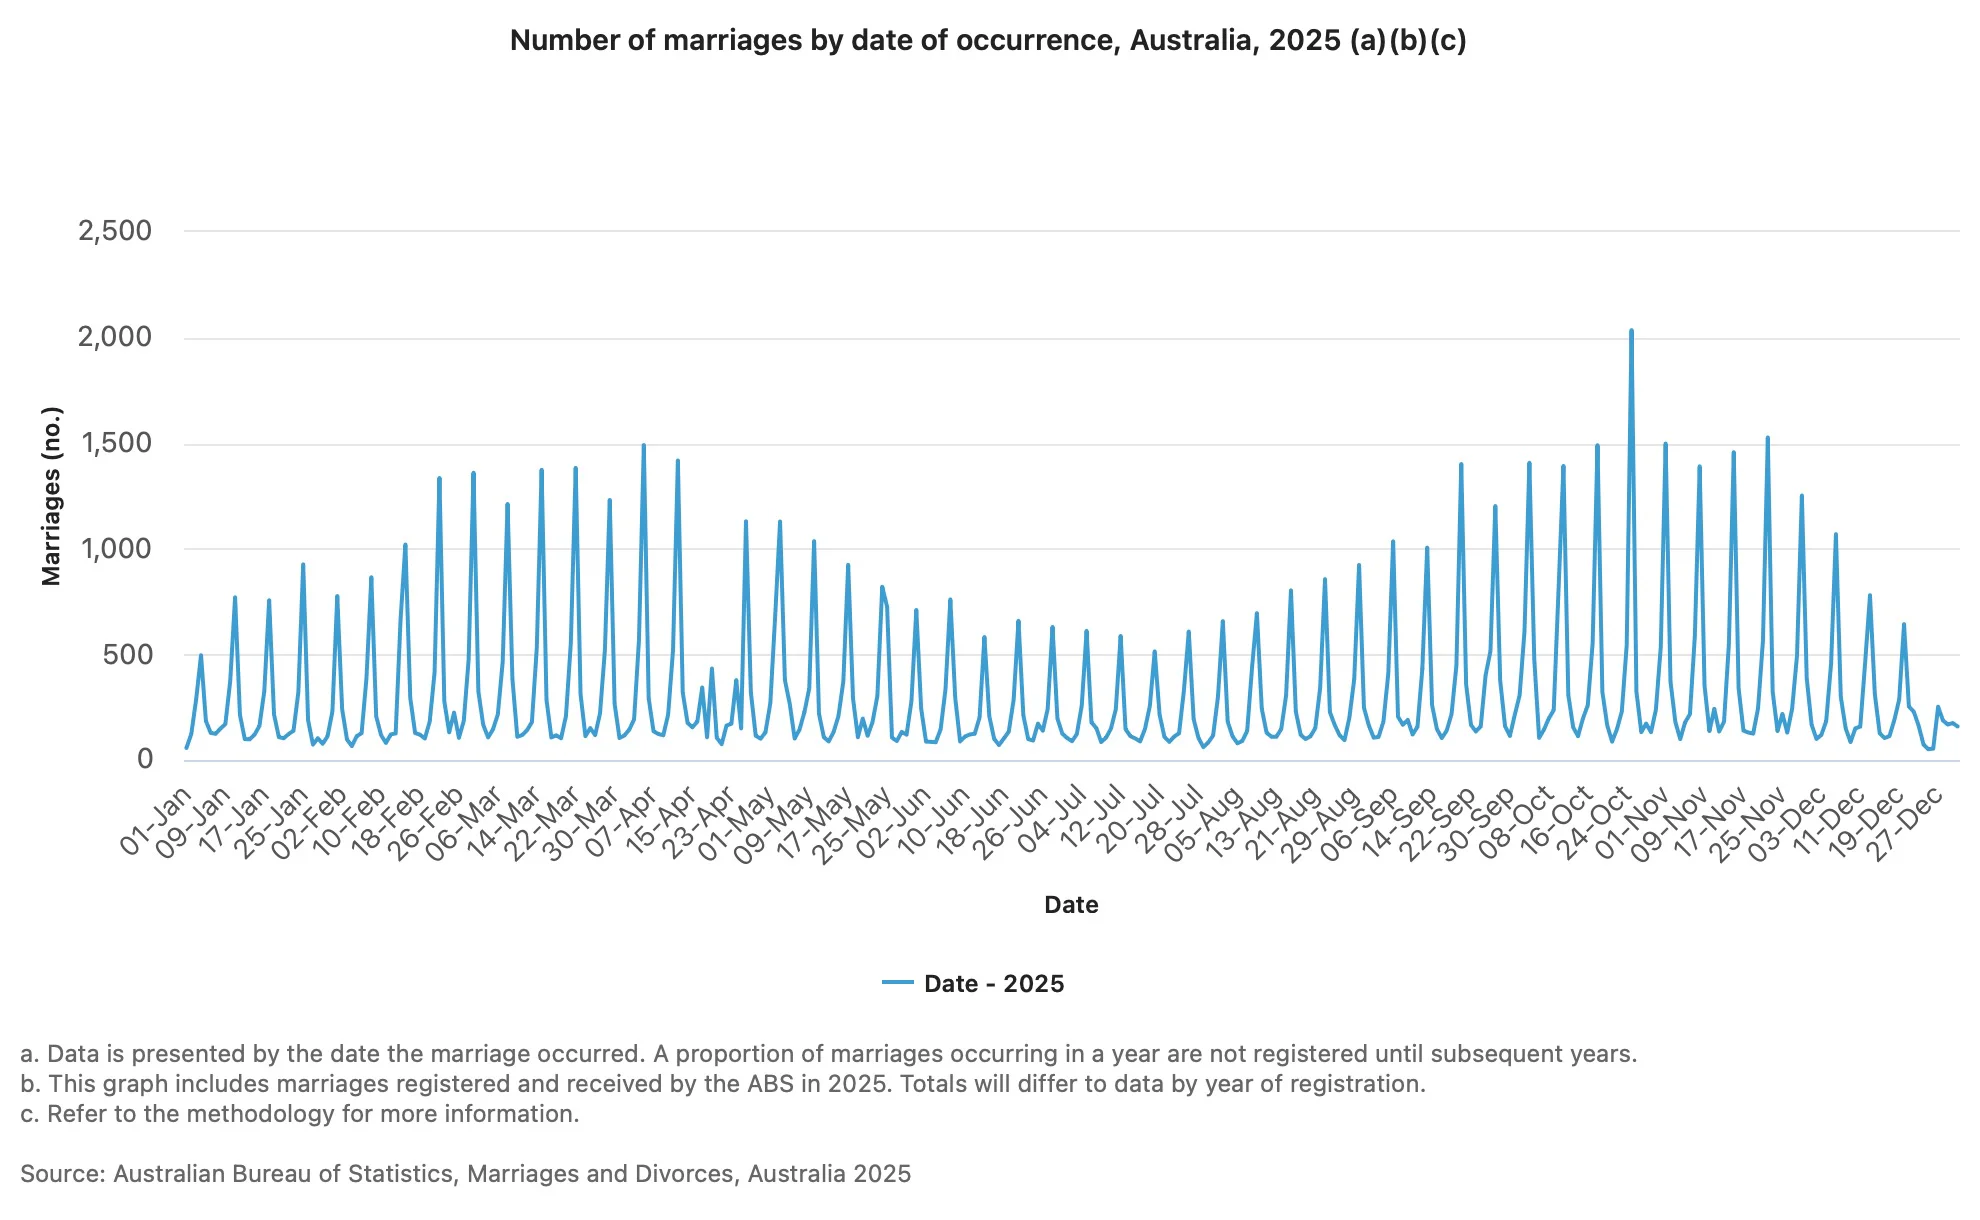
Marriage dates were back to the patterns we used to see prior to COVID-19: peak marriage numbers occur in Spring and Autumn, and lower numbers in Winter, and at Easter and Christmas.
As always, a matching numbers date that fell on a weekend had the highest number of marriages: 2035 marriages took place on 25/10/25. The other most popular dates were scattered across April, October, and November. Saturday remains the most popular day of the week to get married, with 45 of the top 50 marriages dates falling on a Saturday. None of this is a surprise 🙂
You know I love a pretty graph, and here’s another one with the usual Autumn and Spring peaks, drops for Easter and Christmas, and one massive spike on 25 October.
Decreased statistics
From 2022, the ABS decreased the number of statistics they’re releasing on marriage. This means we no longer have information on things like the split between civil and religious marriages, whether this is people’s second marriage, or where people were born (overseas or in Australia). I’m kind of pissed about it, but shy of spending a minimum of $600 (and probably much more) to get more specific questions answered, we’re going to have to make do with what we’ve got. I’m excited that the last draft I saw for the next iteration of the NOIM includes tickboxes for Rites Used (civil celebrants, religious celebrants, and registry officers are all separated out), which should make it easier for the ABS to at least collate data on the split between civil and religious marriages.
So that’s my overview of the 2025 marriage statistics. Let me know if you have any other questions you’d like me to look into!