
It’s marriage statistics release day, somehow three and a half months ahead of schedule! For as many years as I’ve been paying attention to them, the marriage statistics have been released at the end of November or early December. I got my usual daily email from the Australian Bureau of Statistics today, outlining what had been released, and I had to look at it several times to make sure it really did say Marriages and Divorces! Phew, what a moment for this little nerd!
So now that I’ve recovered from the unexpected release, here’s my annual rundown of the marriage statistics for 2023.
Number of marriages
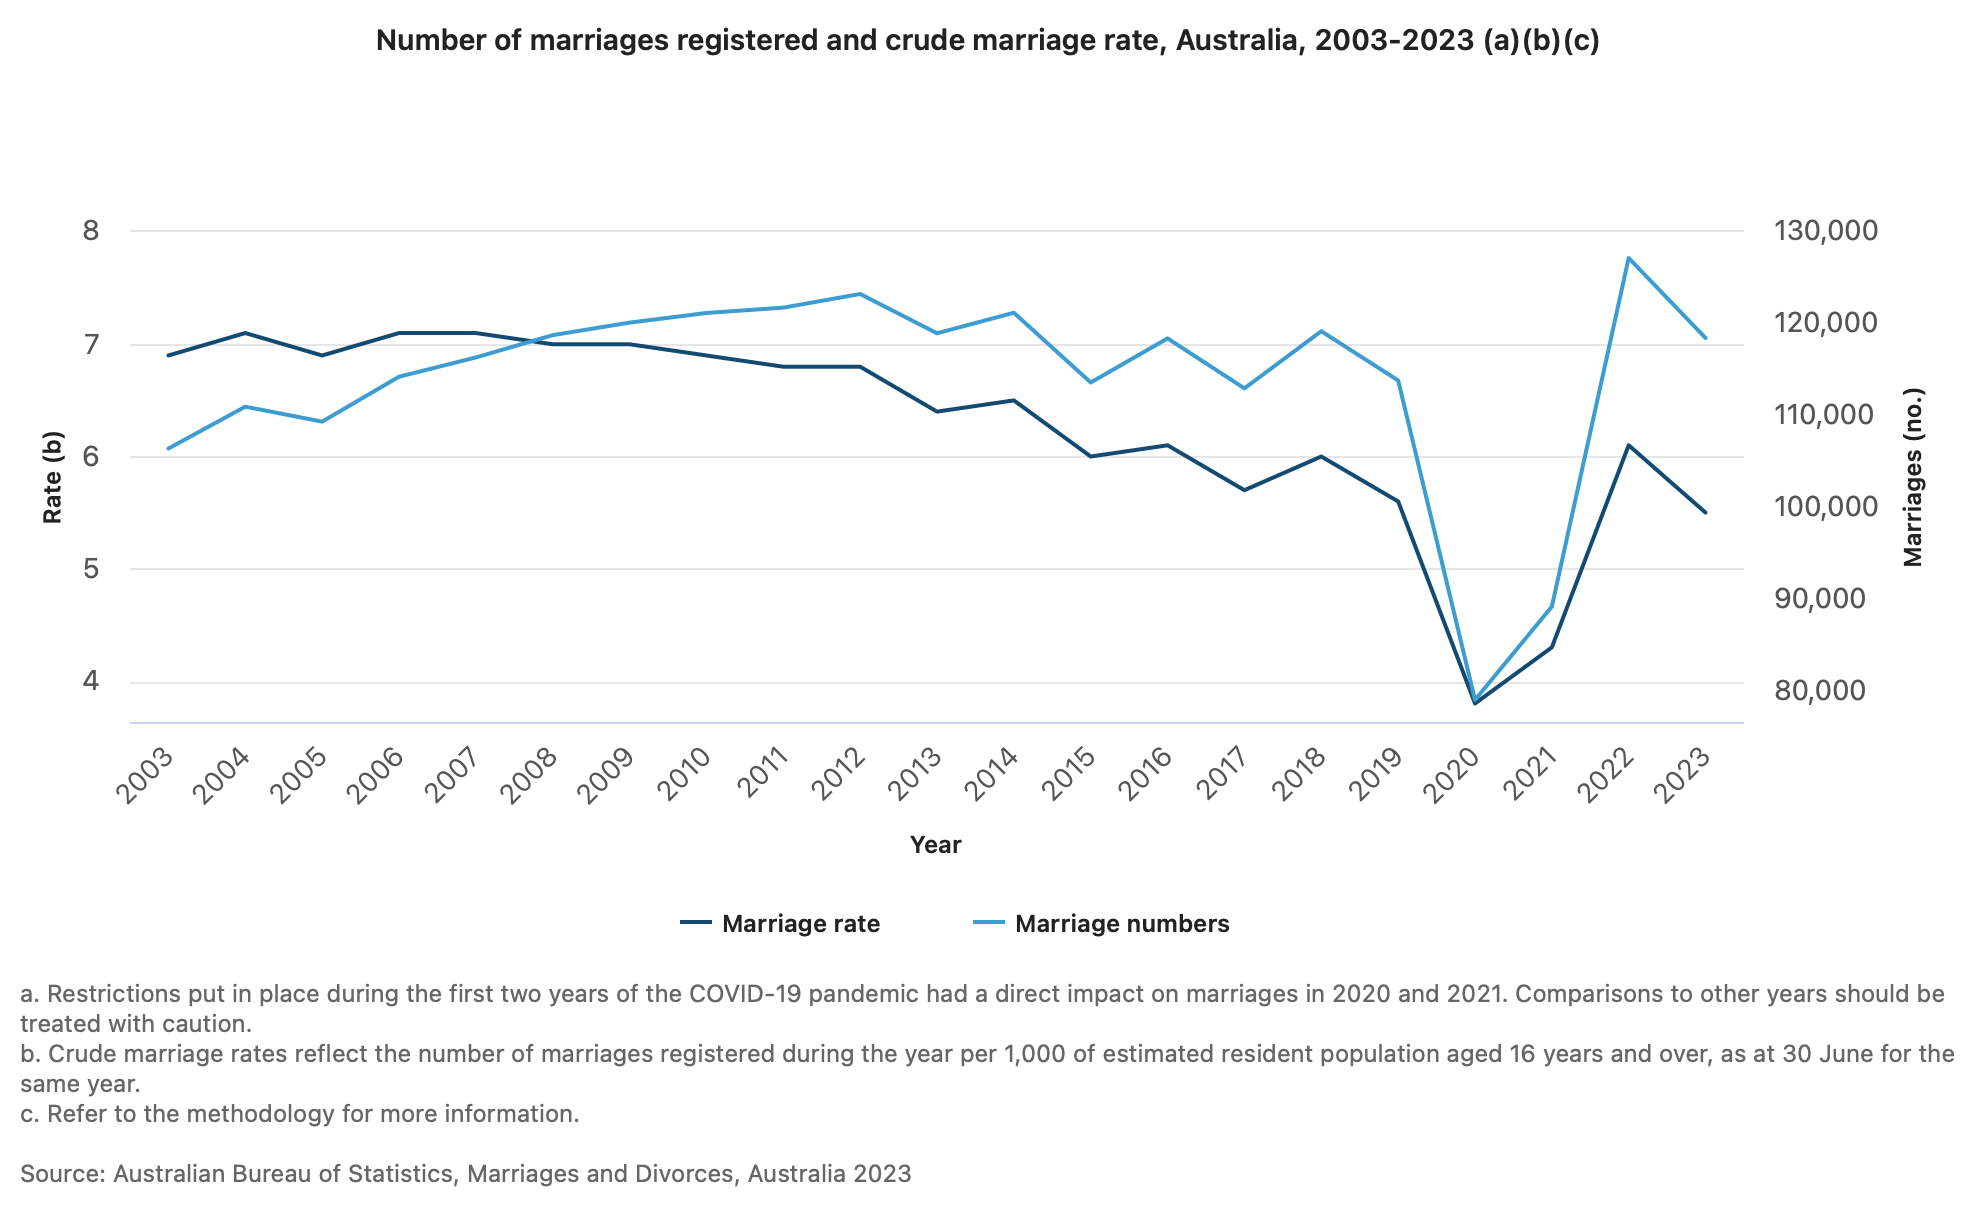
As expected, the number of marriages registered in 2023 dropped from the record high we saw in 2022, which was all the catching up after COVID postponements. 2023 saw 118,439 marriage registered, 6.9% fewer than 2022. The numbers were still well above the record lows we saw during the pandemic lockdown years of 2020 and 2021. I don’t think we’ve quite settled into a new normal yet, especially with the downturn we’ve seen in 2024 with the cost of living crisis etc, but we’re definitely heading back to more “normal” numbers.
As I did last year, I’m posting this graph because pictures are often more useful than words in these situations. Check out that COVID dip, the extreme recovery of 2022, and the drop again in 2023.
Gender
I am LOVING the info we now have on gender in marriages. Last year was the first year we had some numbers on marriages including at least one person identifying as non-binary, due to the release of the new marriage documentation in September 2021. In 2022 there were 159 marriages that involved at least one non-binary person. In 2023, that number has jumped to 204.
However, marriages of two partners identifying as male were down a bit (1767 to 1735), marriages of two partners identifying as female were down a bit (2667 to 2619). Therefore total marriages involving the same gender or at least one non-binary person were down a tiny bit overall (4593 to 4558).
I’ve written on my own blog about my interest in these growing statistics on non-binary people getting married, and whether this tells us something about more common usage of this gender identity in the general population. I’m not a researcher, but I think it’s an interesting question.
Age
The age people get married at continues to climb ever so slightly: 32.9 was the median age for men to marry (as opposed to 32.5 years in 2022), and 31.2 was the median age for women to marry (against 30.9 years in 2022).
Location
As expected, there were fewer marriages in every state and territory than 2022, except for South Australia and Western Australia. For some completely unknown reason, marriage in both those states was not only higher than in 2022, but higher than 2019, pre-pandemic!
WA saw 16.8% more marriages in 2023 than 2022, and 12.5% more marriages than in 2019. SA saw 7.1% more marriages in 2023 than 2022, and 9.3% more than in 2019. Any WA or SA celebrants want to make a comment as to why they think this happened??
The ACT saw the largest decline in marriages (14.1% fewer than 2022), NSW (13.2% fewer), and Tassie (11.2% fewer).
Vic, QLD, Tassie, and the ACT, despite recording fewer marriages in 2023 than in 2022, all recorded more marriages than in 2019, pre-COVID. As with WA and SA, I’m pretty surprised by that. Only NT and NSW recorded fewer marriages in 2023 than in 2019.
As I said last year and above, I don’t think this is the end of the rebalancing of marriage numbers. We may need to wait another few years to see what happens next.

Source: Australian Bureau of Statistics, Marriages and Divorces, Australia 2022
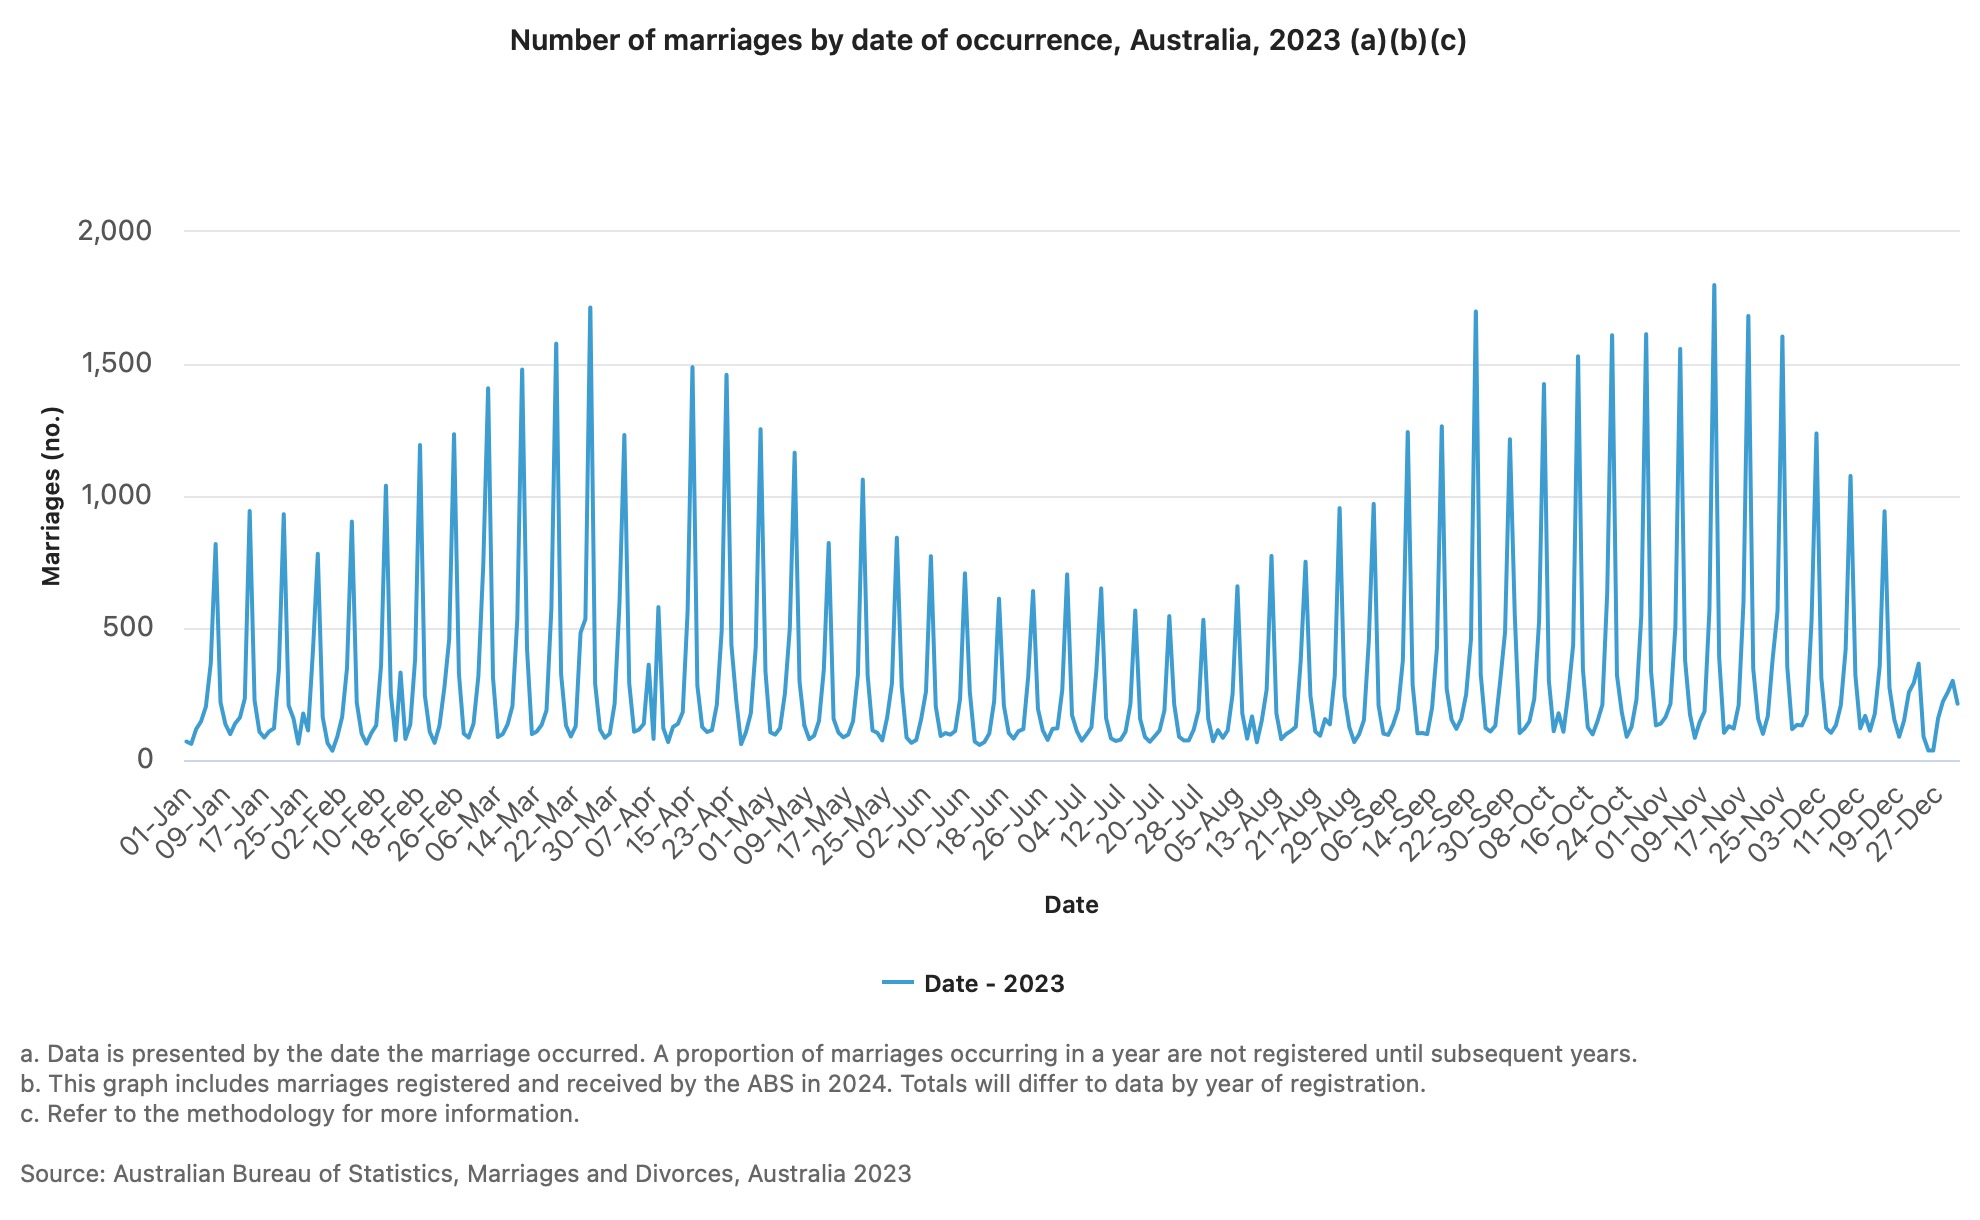
Date
Marriage dates were back to the patterns we used to see prior to COVID-19: peak marriage numbers occur in Spring and Autumn, and lower numbers in Winter, and at Easter and Christmas.
The most popular day for marriage in 2023 was 11/11/2023 – it’s always handy when the matching numbers fall on the weekend! There were 1799 marriages that day, 85 more than the 1714 marriages that fell on 25/3/2023.
Here’s a pretty graph showing those lovely Autum and Spring peaks, with rather dramatic drops for Easter and Christmas:
Divorces
We were back to more usual numbers of divorces with 48,700 finalised in 2023, down 1.1% from the 49,241 granted in 2022. Again, no huge jumps as may have been expected coming out of the COVID era; continue to watch this space.
Decreased statistics
From last year, the ABS has decreased the number of statistics they’re releasing on marriage and divorce. This means we no longer have information on things like the split between civil and religious marriages, whether this is people’s second marriage, where people were born (overseas or in Australia). I’m kind of pissed about it, but shy of spending a minimum of $600 (and probably much more) to get more specific questions answered, we’re going to have to make do with what we’ve got.
So that’s my overview of the 2023 marriage and divorce statistics. Let me know if you have any other questions you’d like me to look into!


The oracle is for the people ❤️
Only Sarah can make stats interesting and useful 🙏🏽